DRAFT — not yet published
Delivery adds 28% to the same McDonald's order in the US
As fast food pricing becomes more data-driven, Drive Thru Index compared the delivery and pickup prices of the same items at 13,495 McDonald's restaurants across the US on October 1, 2026. Delivery costs 28% more on average.
Data as of .
Key facts
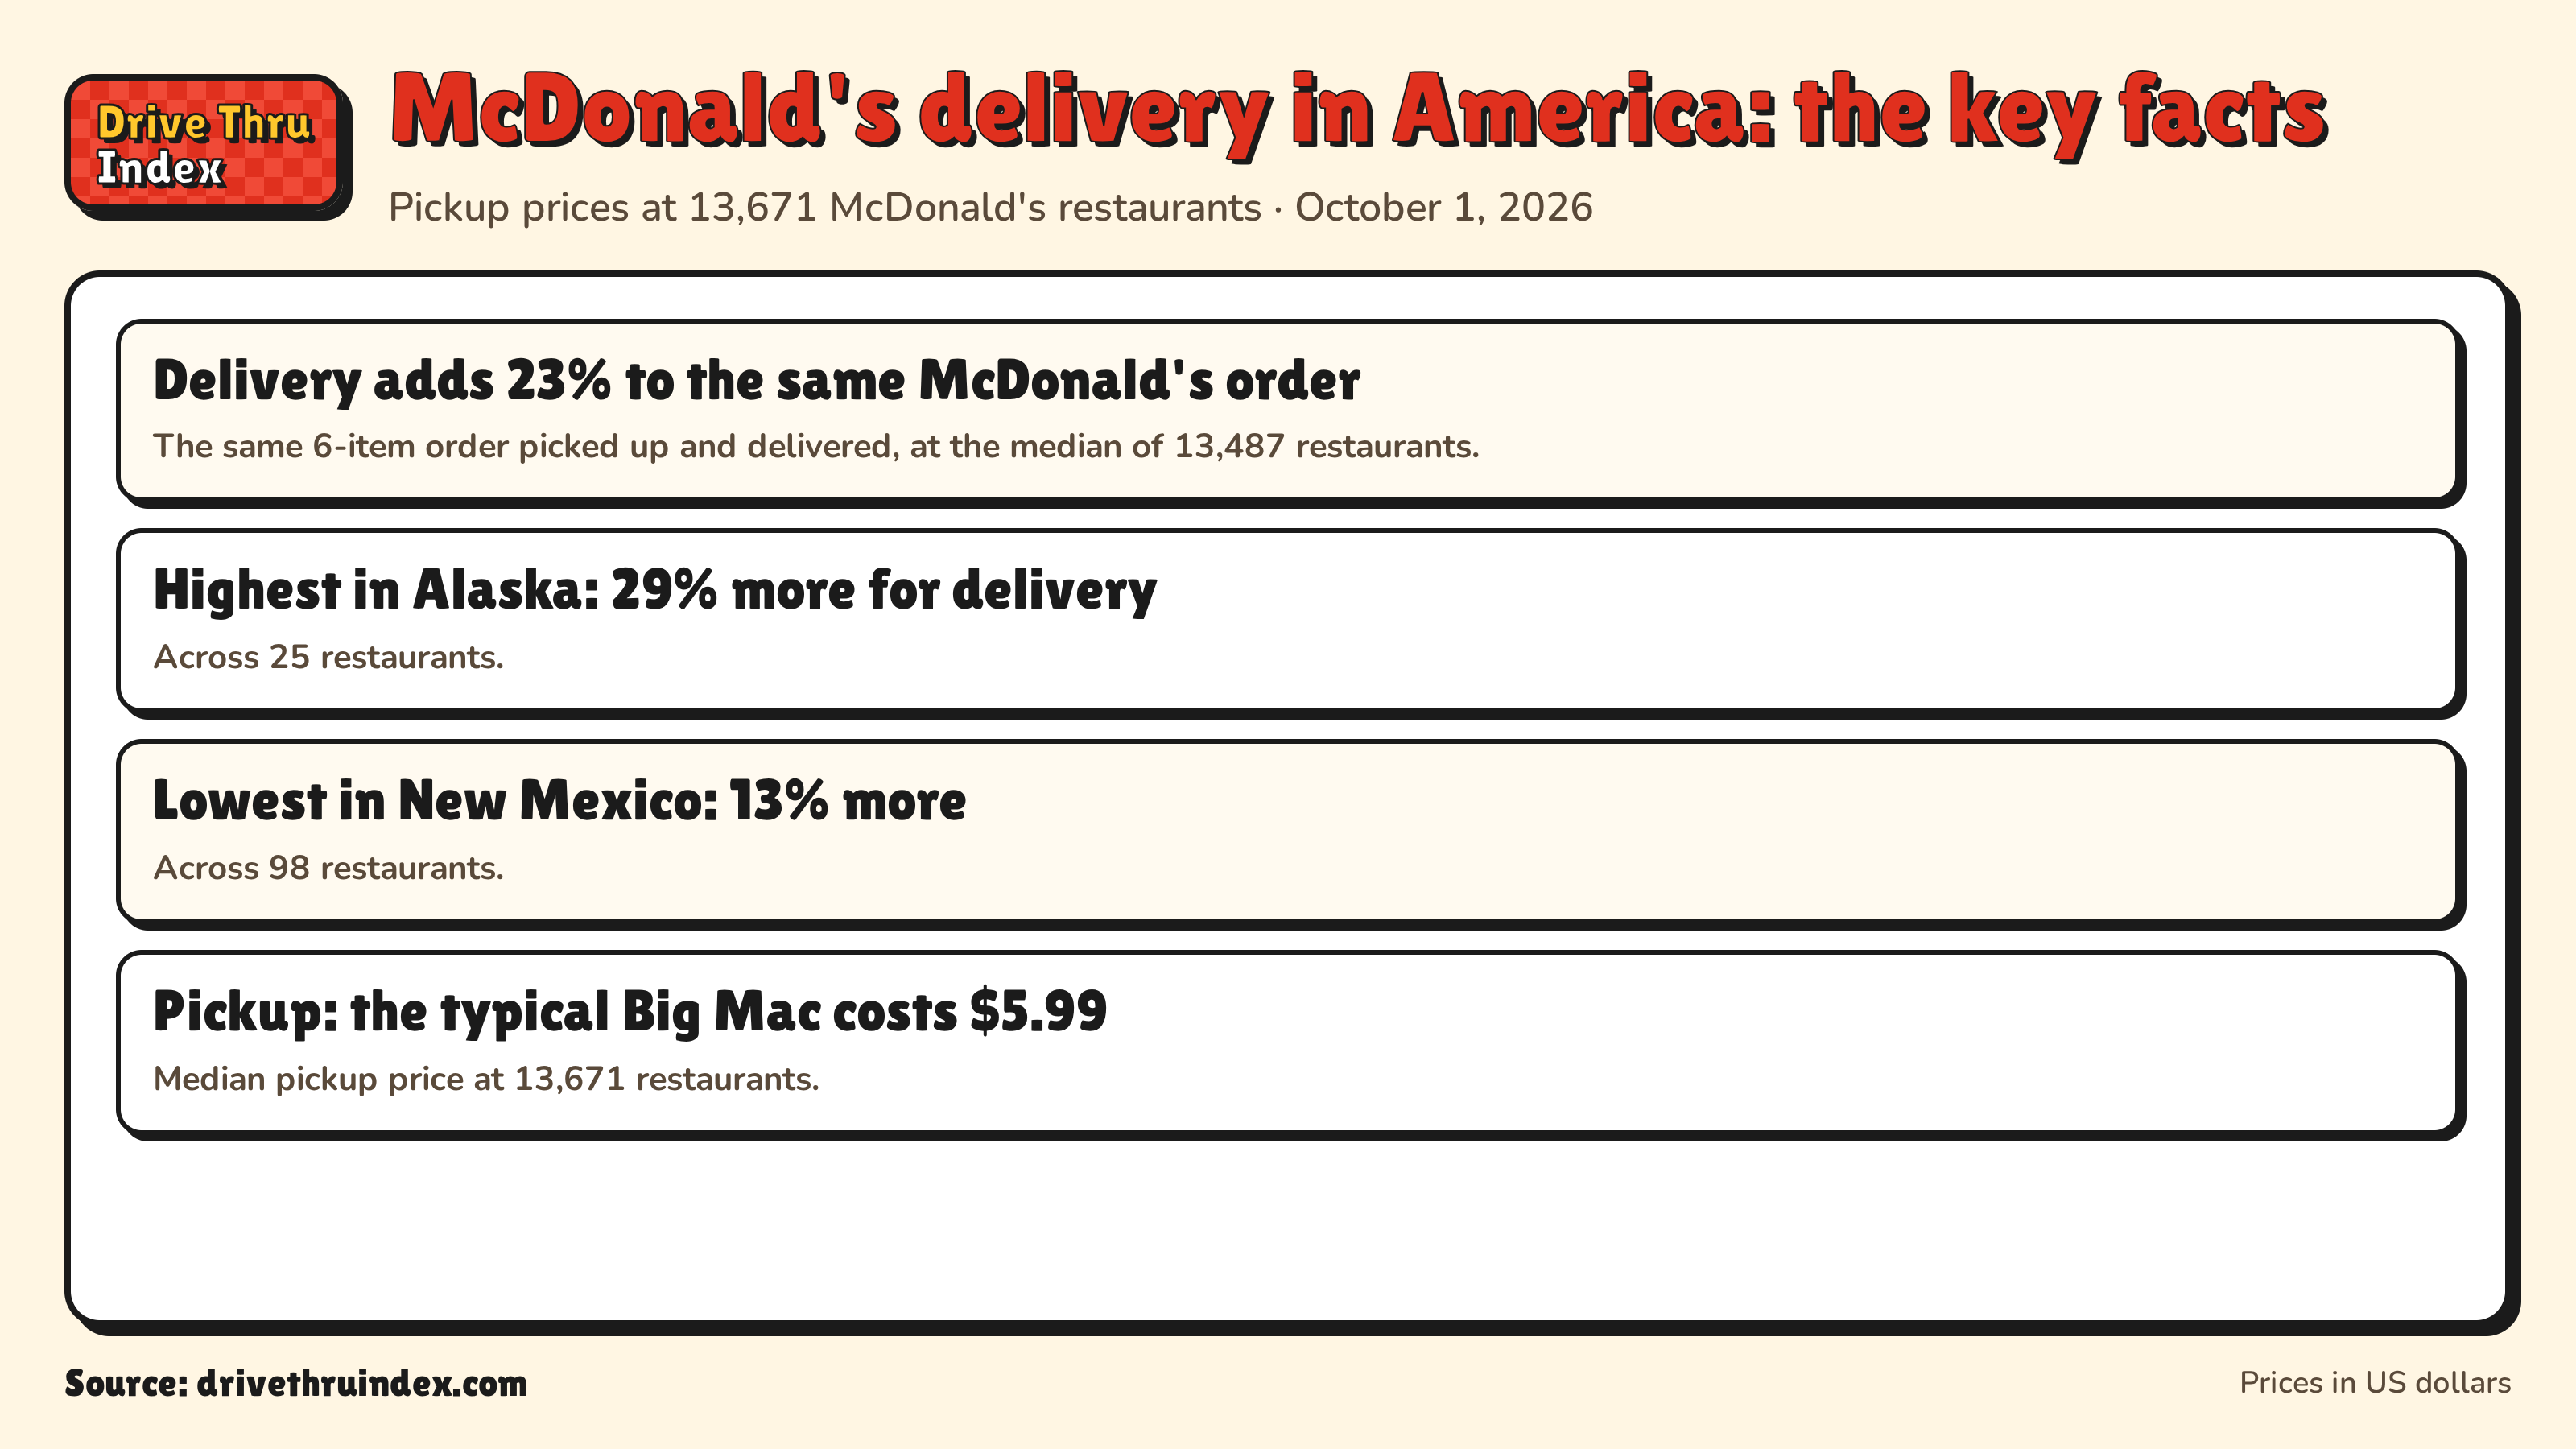
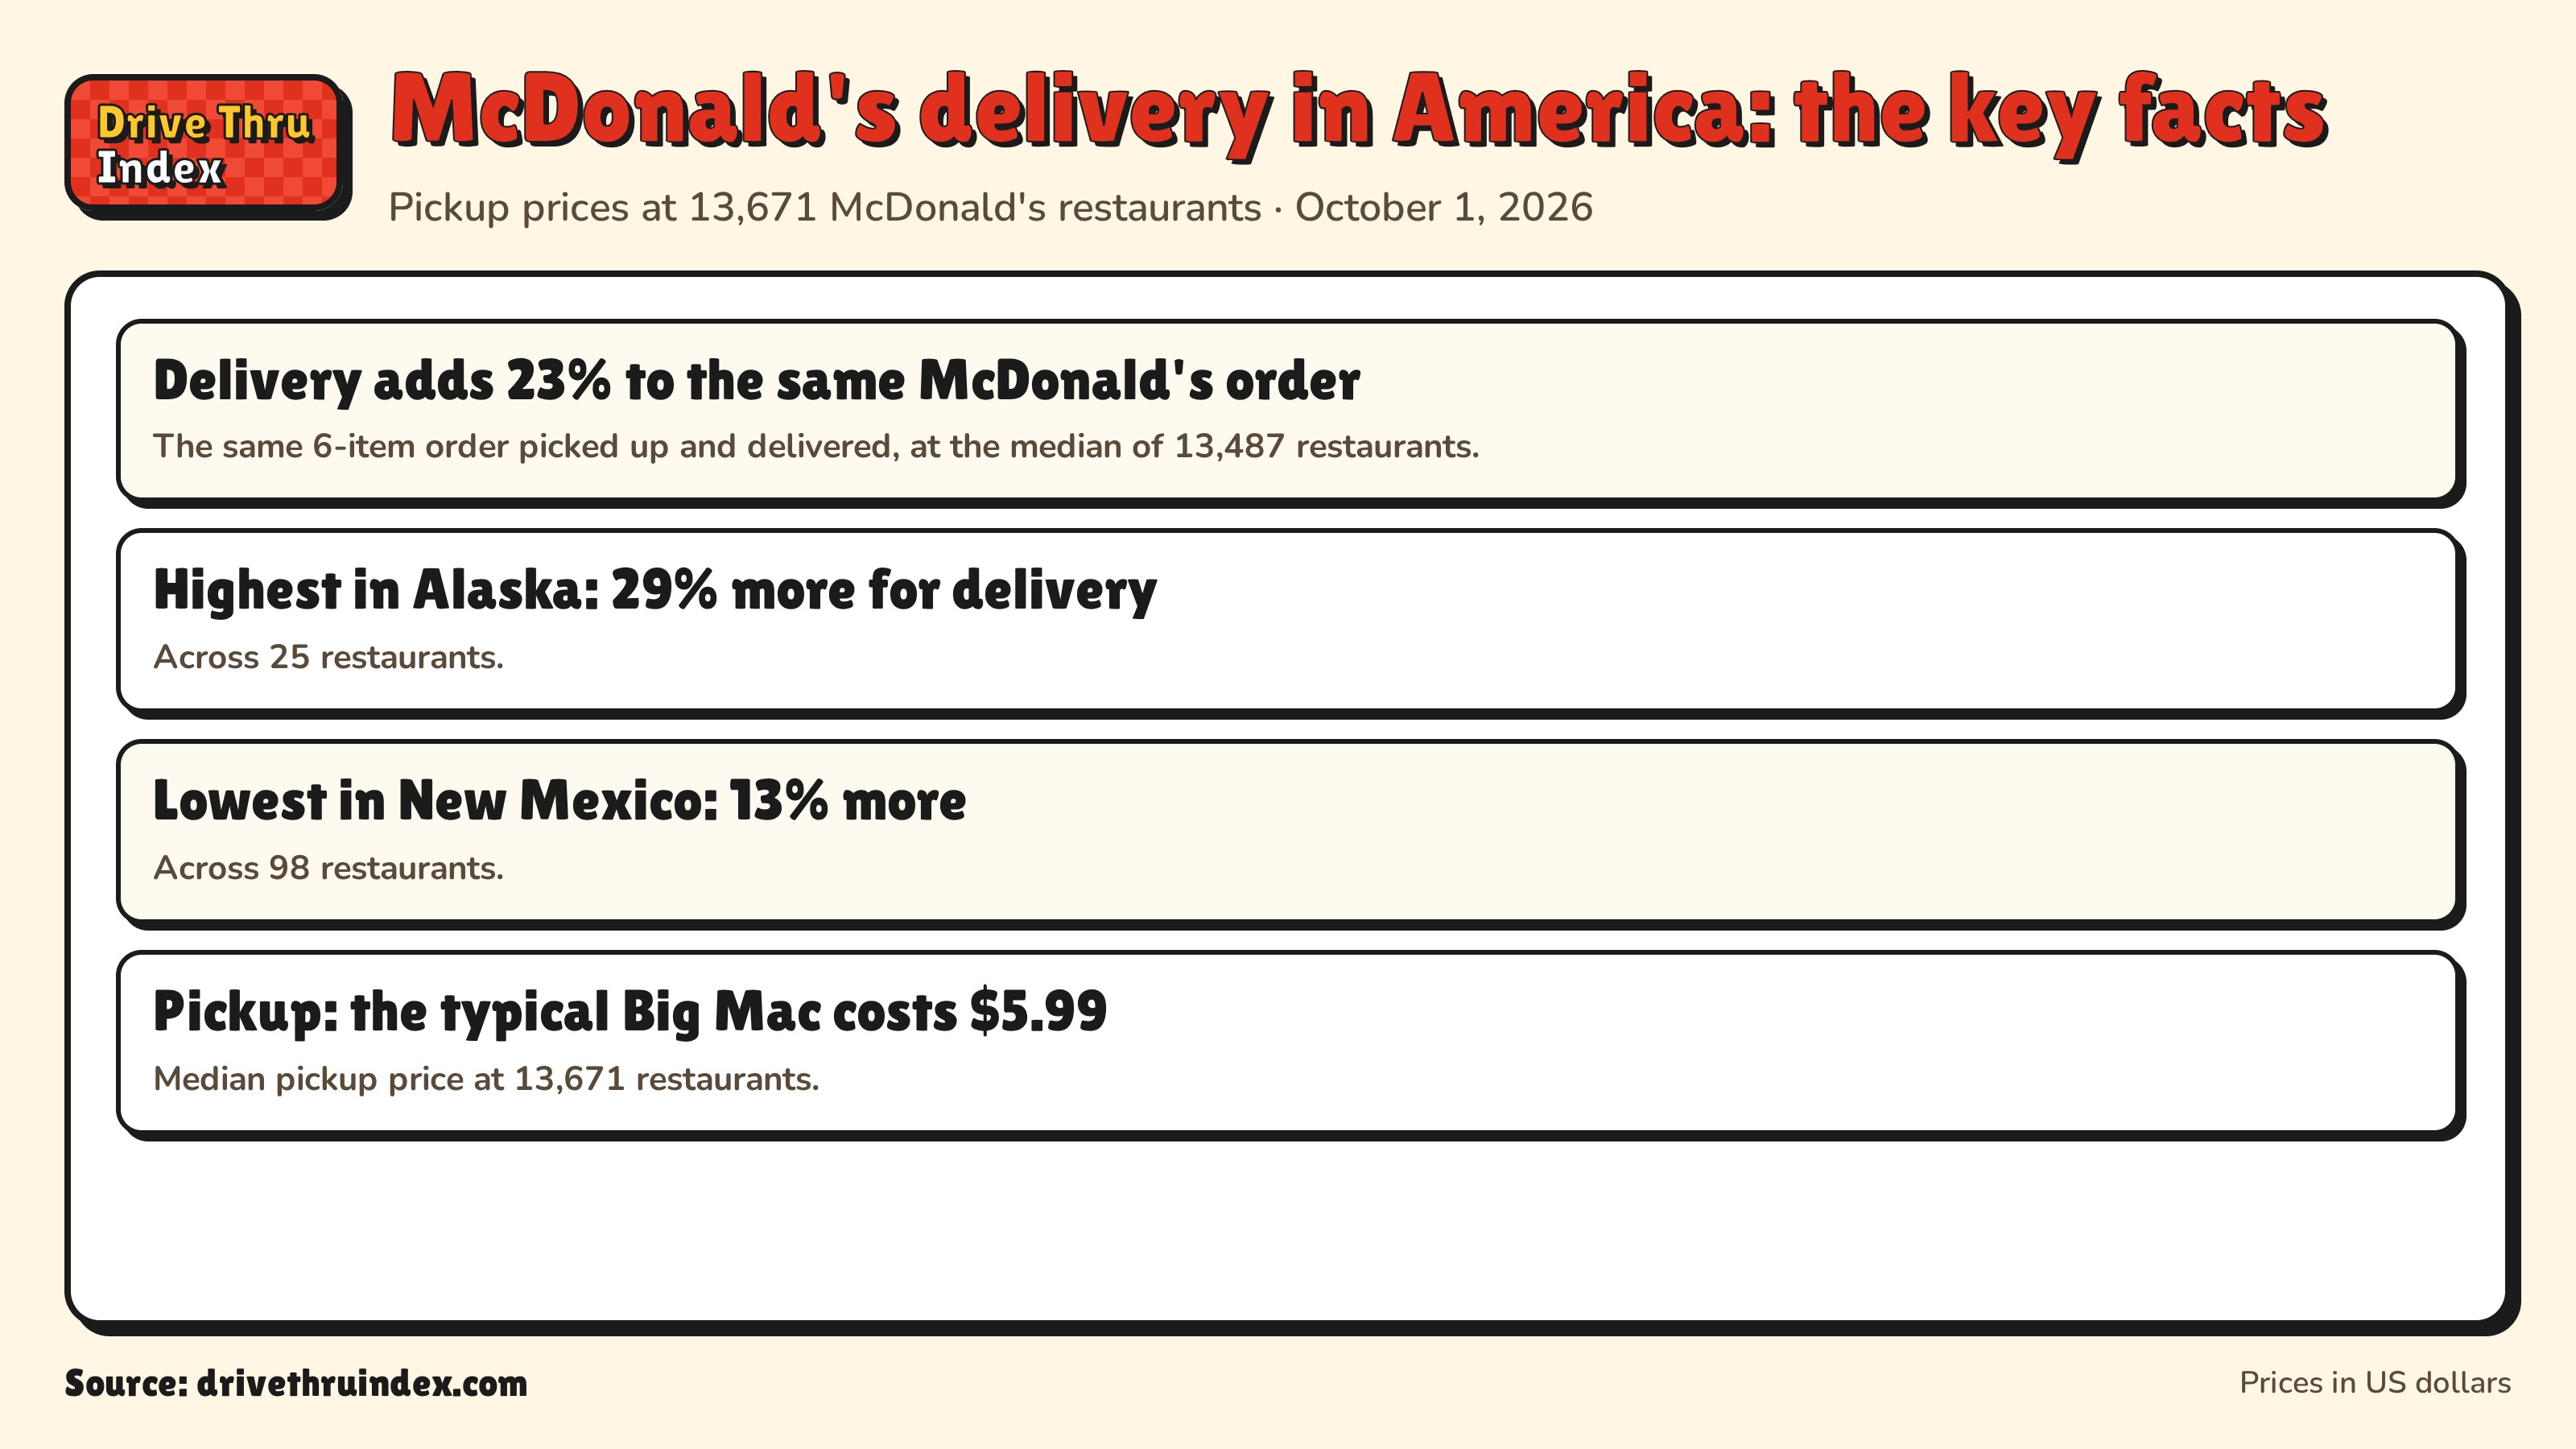
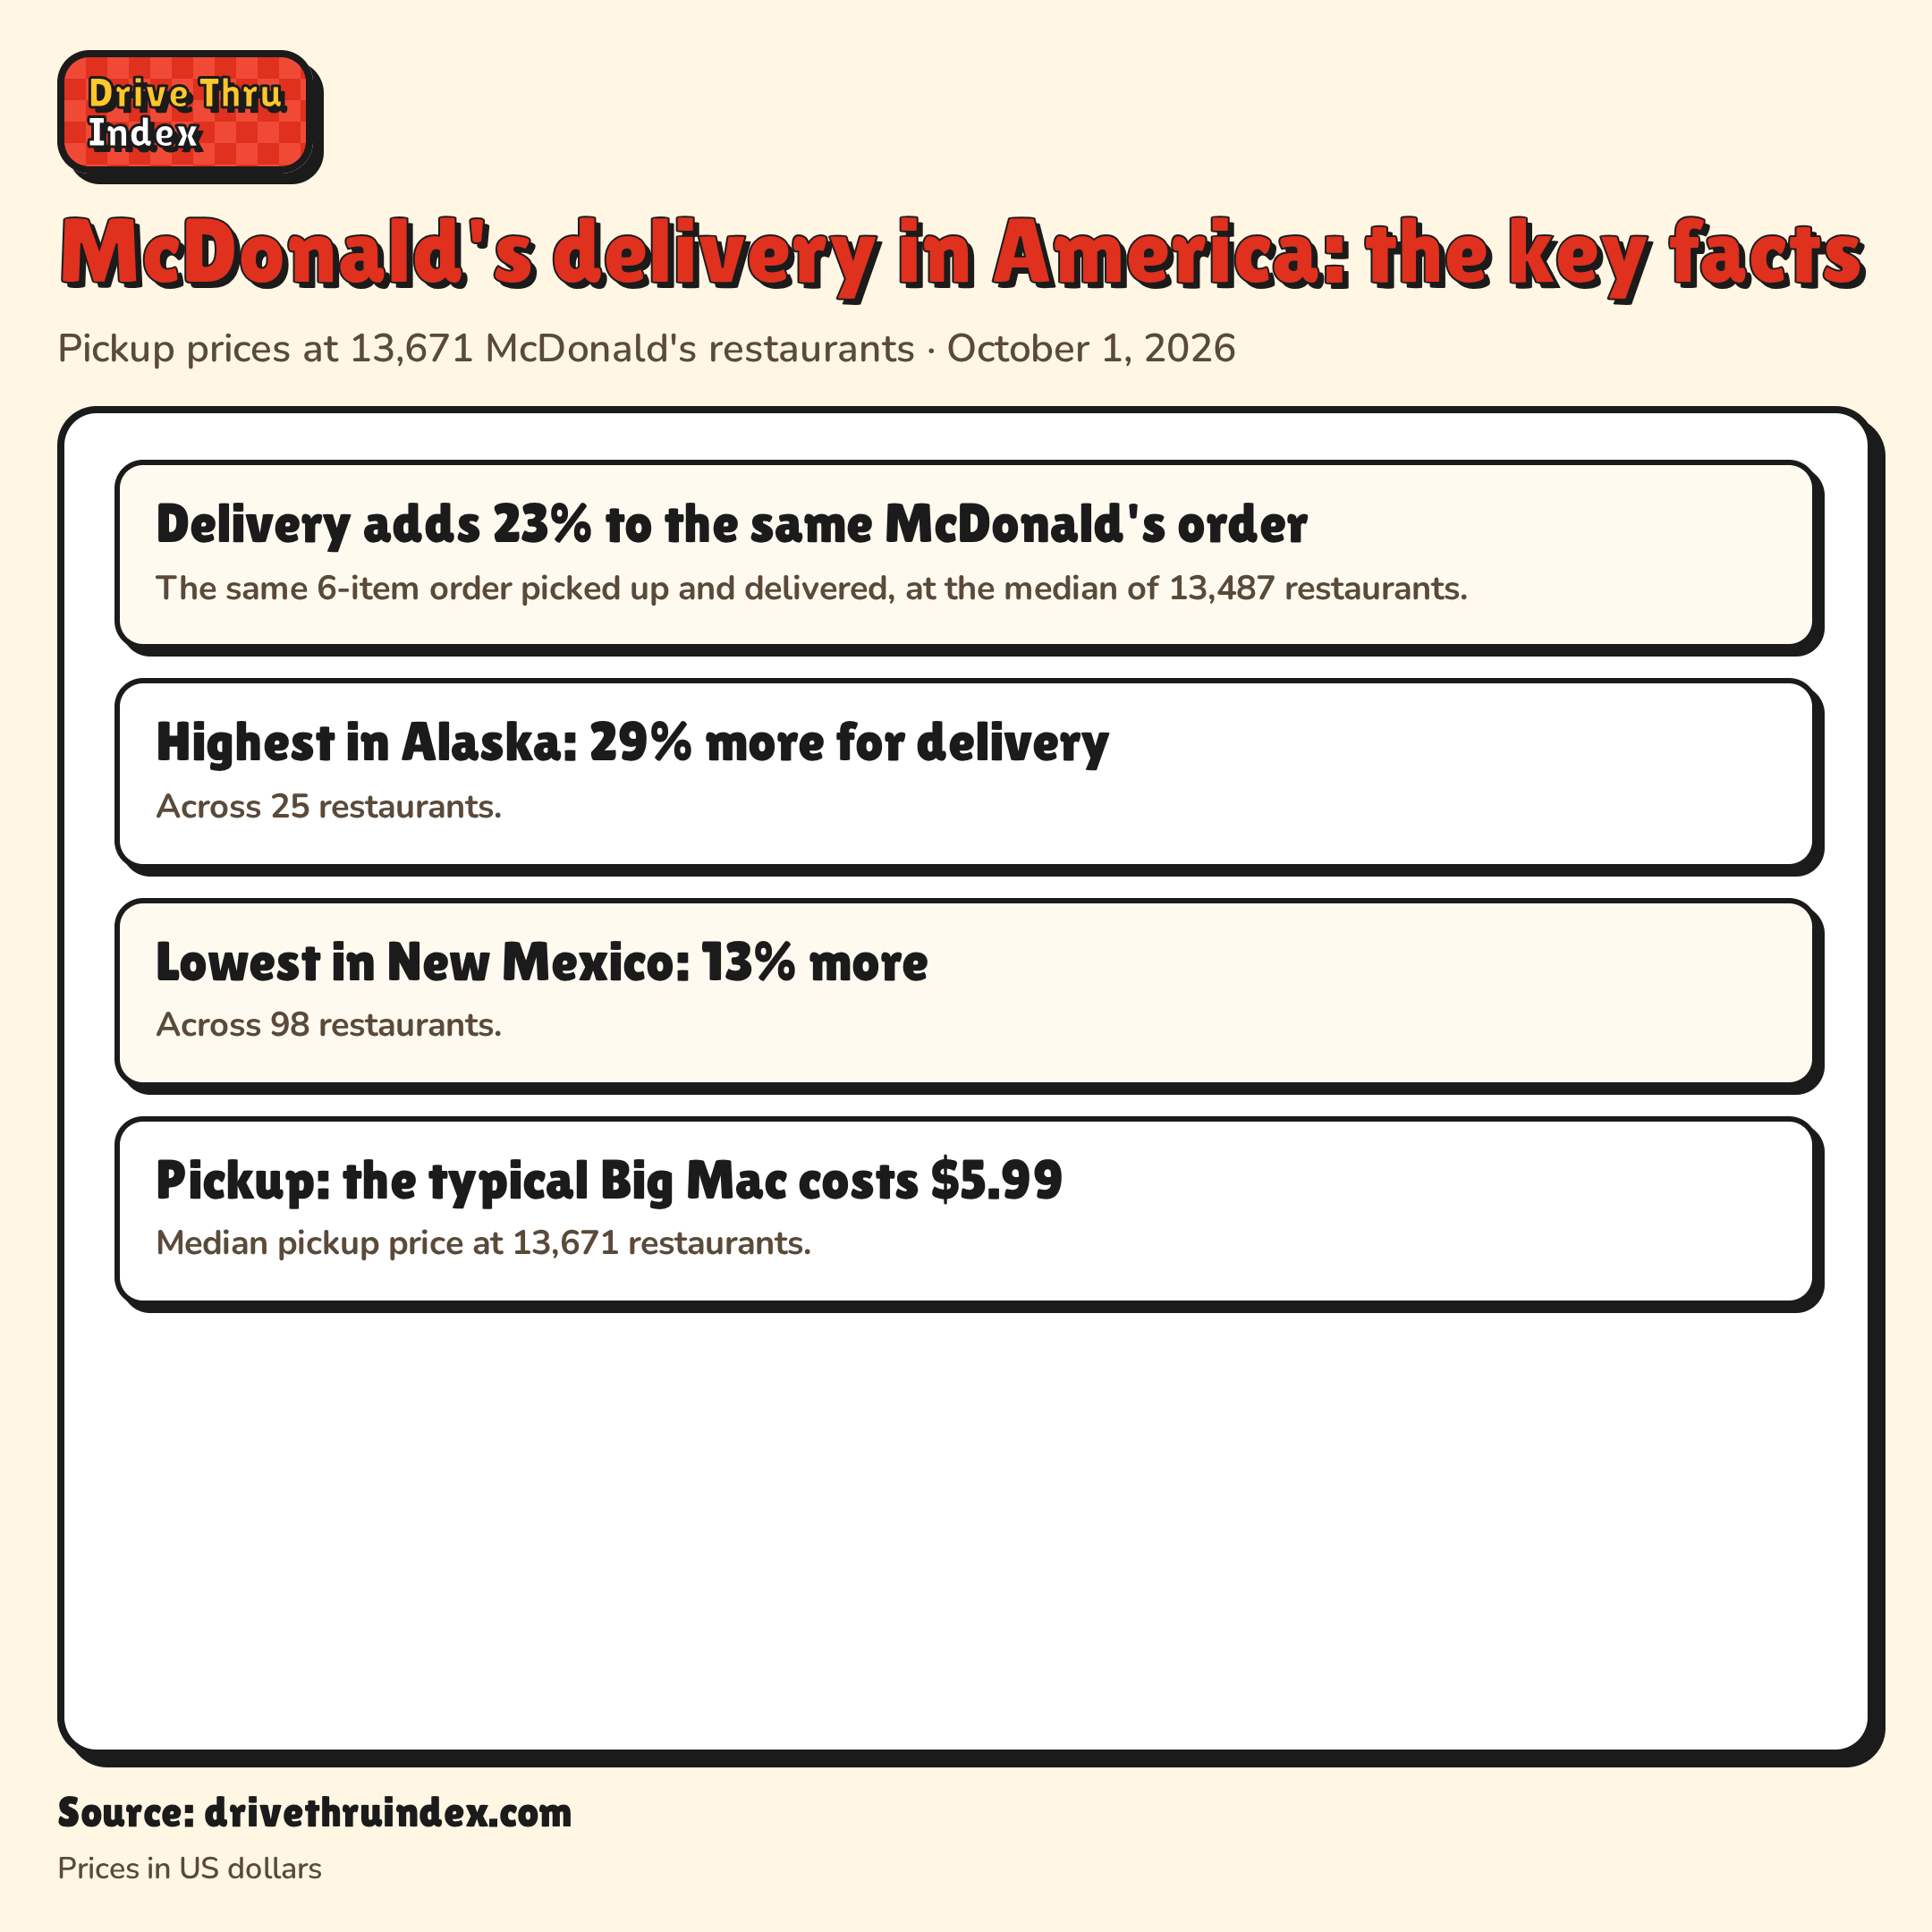
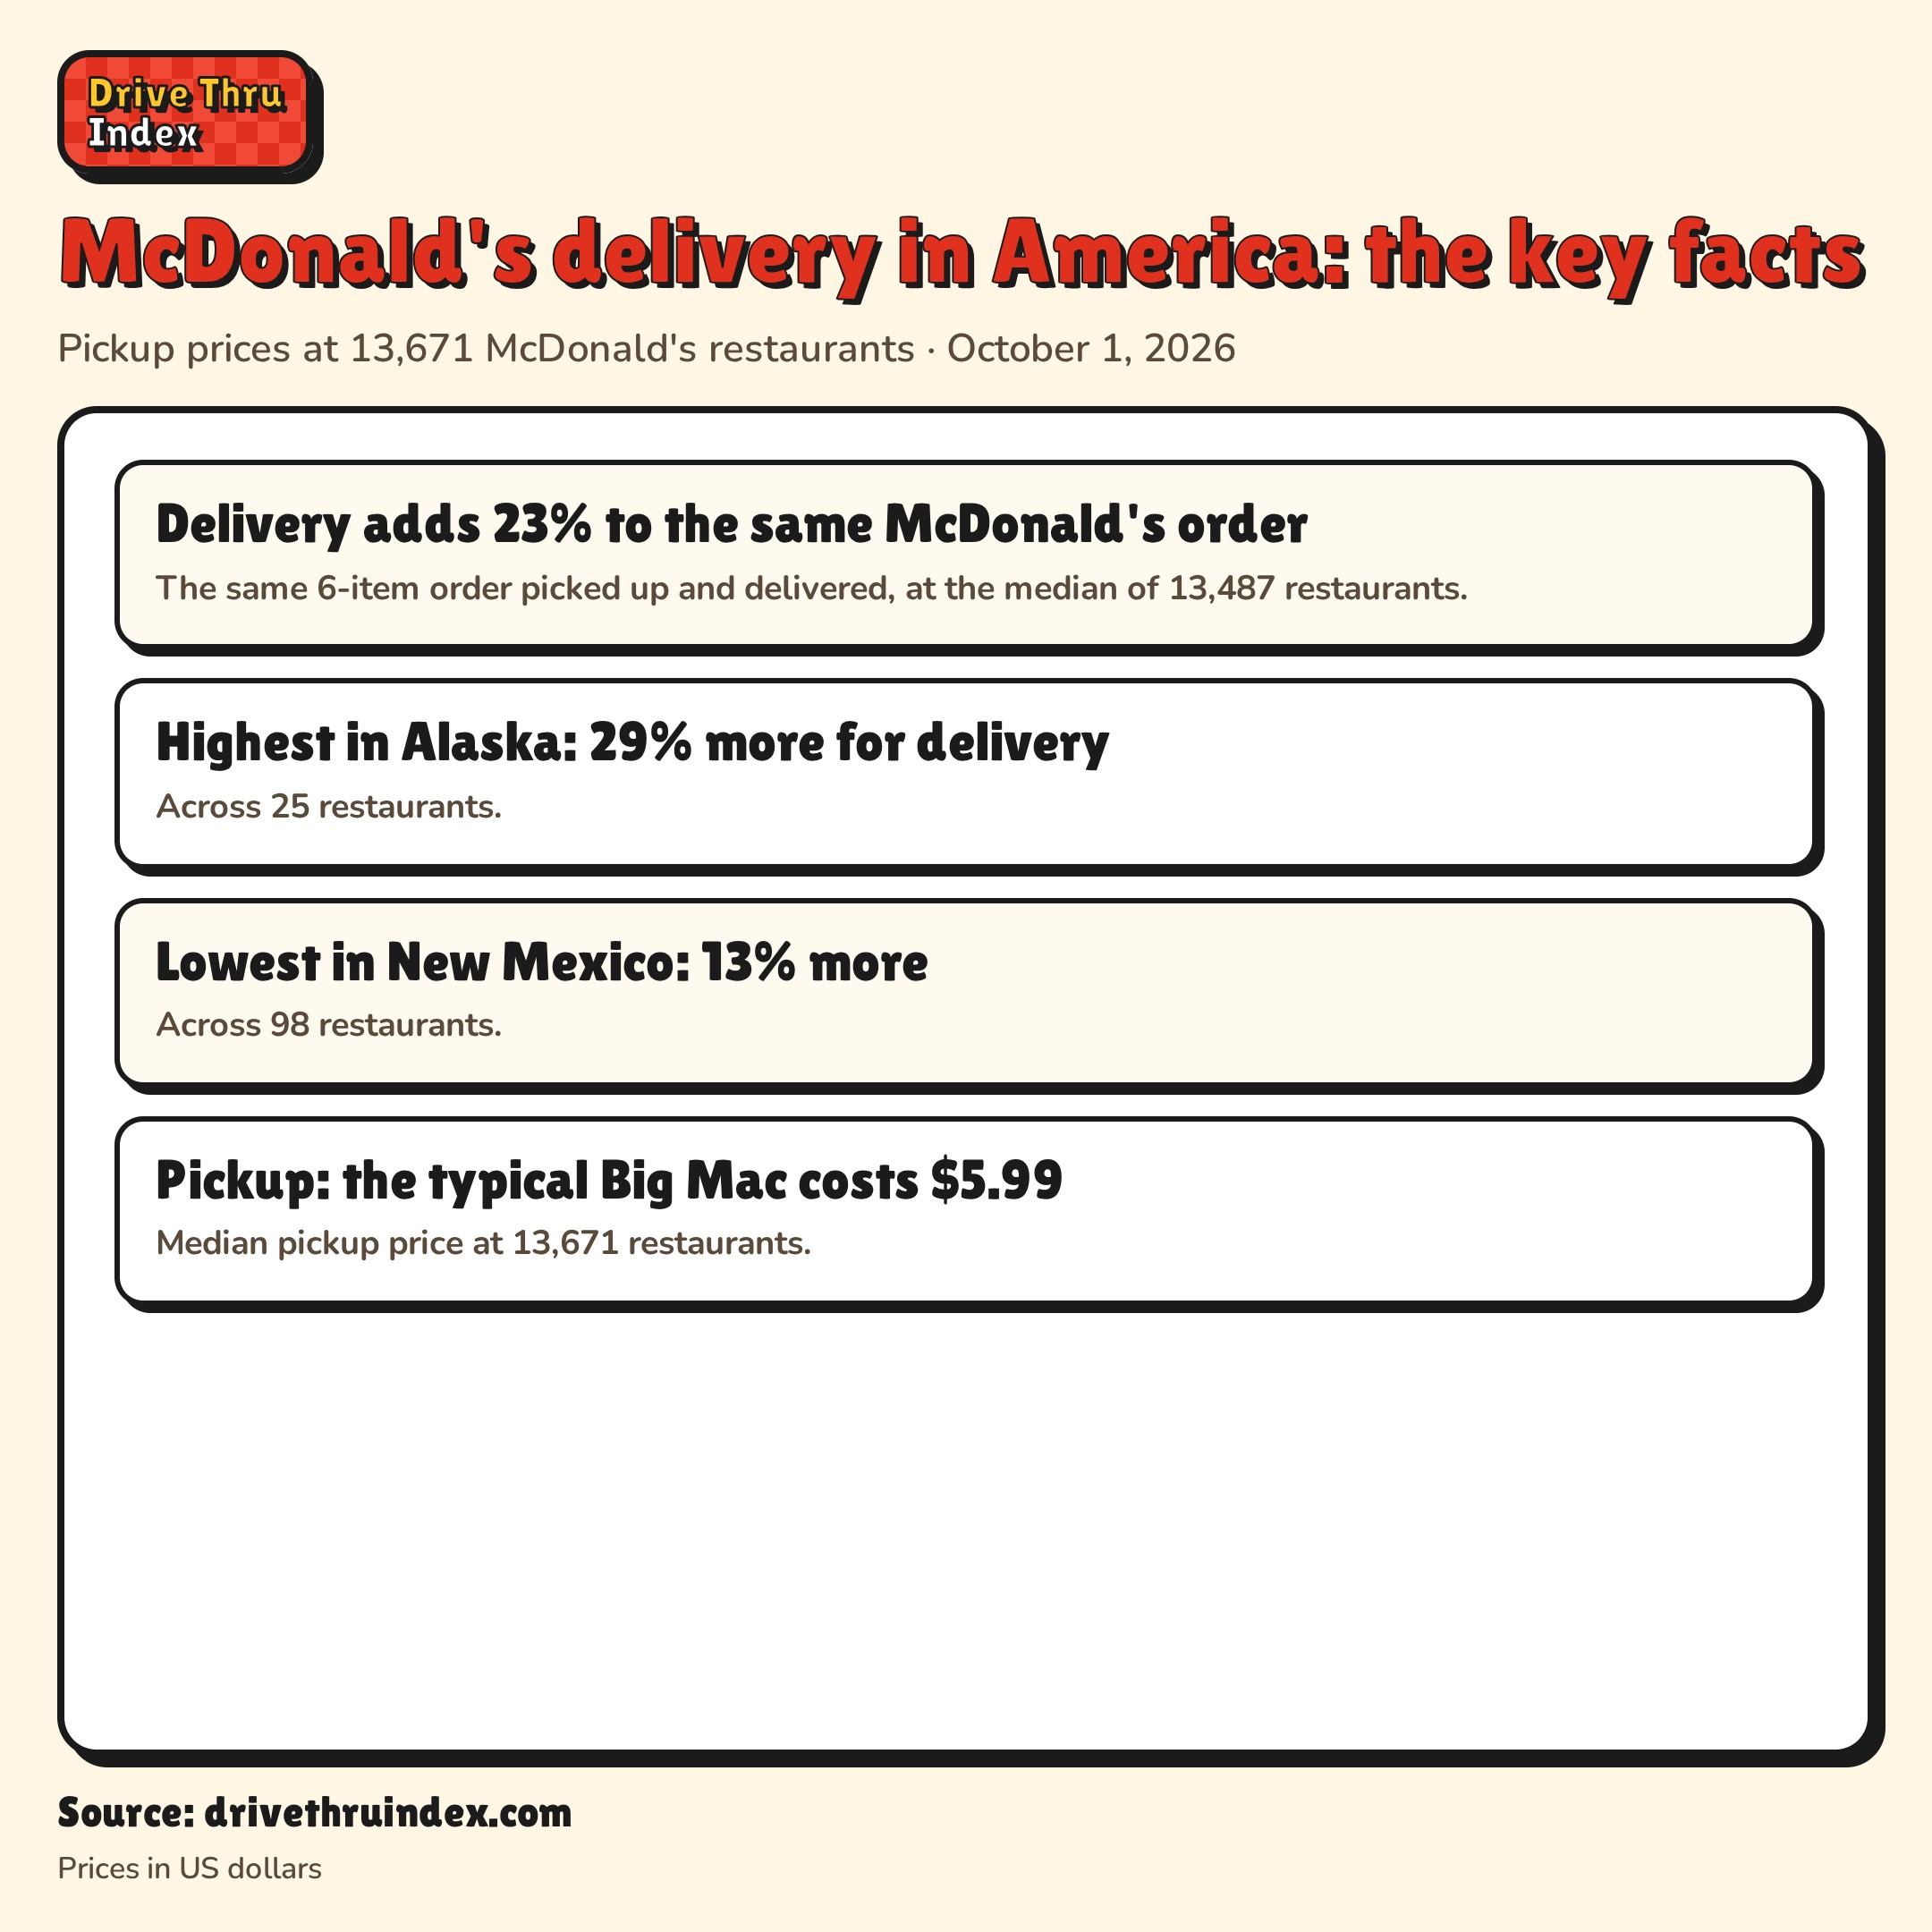
- Delivery adds 28% to the same McDonald's orderAverage markup on items priced for both pickup and delivery, at 13,495 restaurants.
- Highest in Ohio: 57% more for deliveryAcross 600 restaurants.
- Lowest in New Mexico: 19% moreAcross 99 restaurants.
- Pickup: the typical Big Mac costs $5.99Median pickup price at 13,671 restaurants.
Fast food chains are collecting more and more data about their customers through mobile apps and loyalty programs: accounts with their details, and what they order and when. They are also experimenting with AI and data-driven pricing. Meanwhile the same item can cost very different amounts from one restaurant to the next, and customers cannot see why. Drive Thru Index publishes every restaurant's real price, every day, so anyone can check. McDonald's said in August 2026 that across 70 markets it had nearly 220 million loyalty users active in the previous 90 days, and $40 billion in systemwide sales to loyalty members over the previous twelve months.
On October 1, 2026, ordering from McDonald's for delivery cost 28% more on average than picking up the same items from the same restaurant.
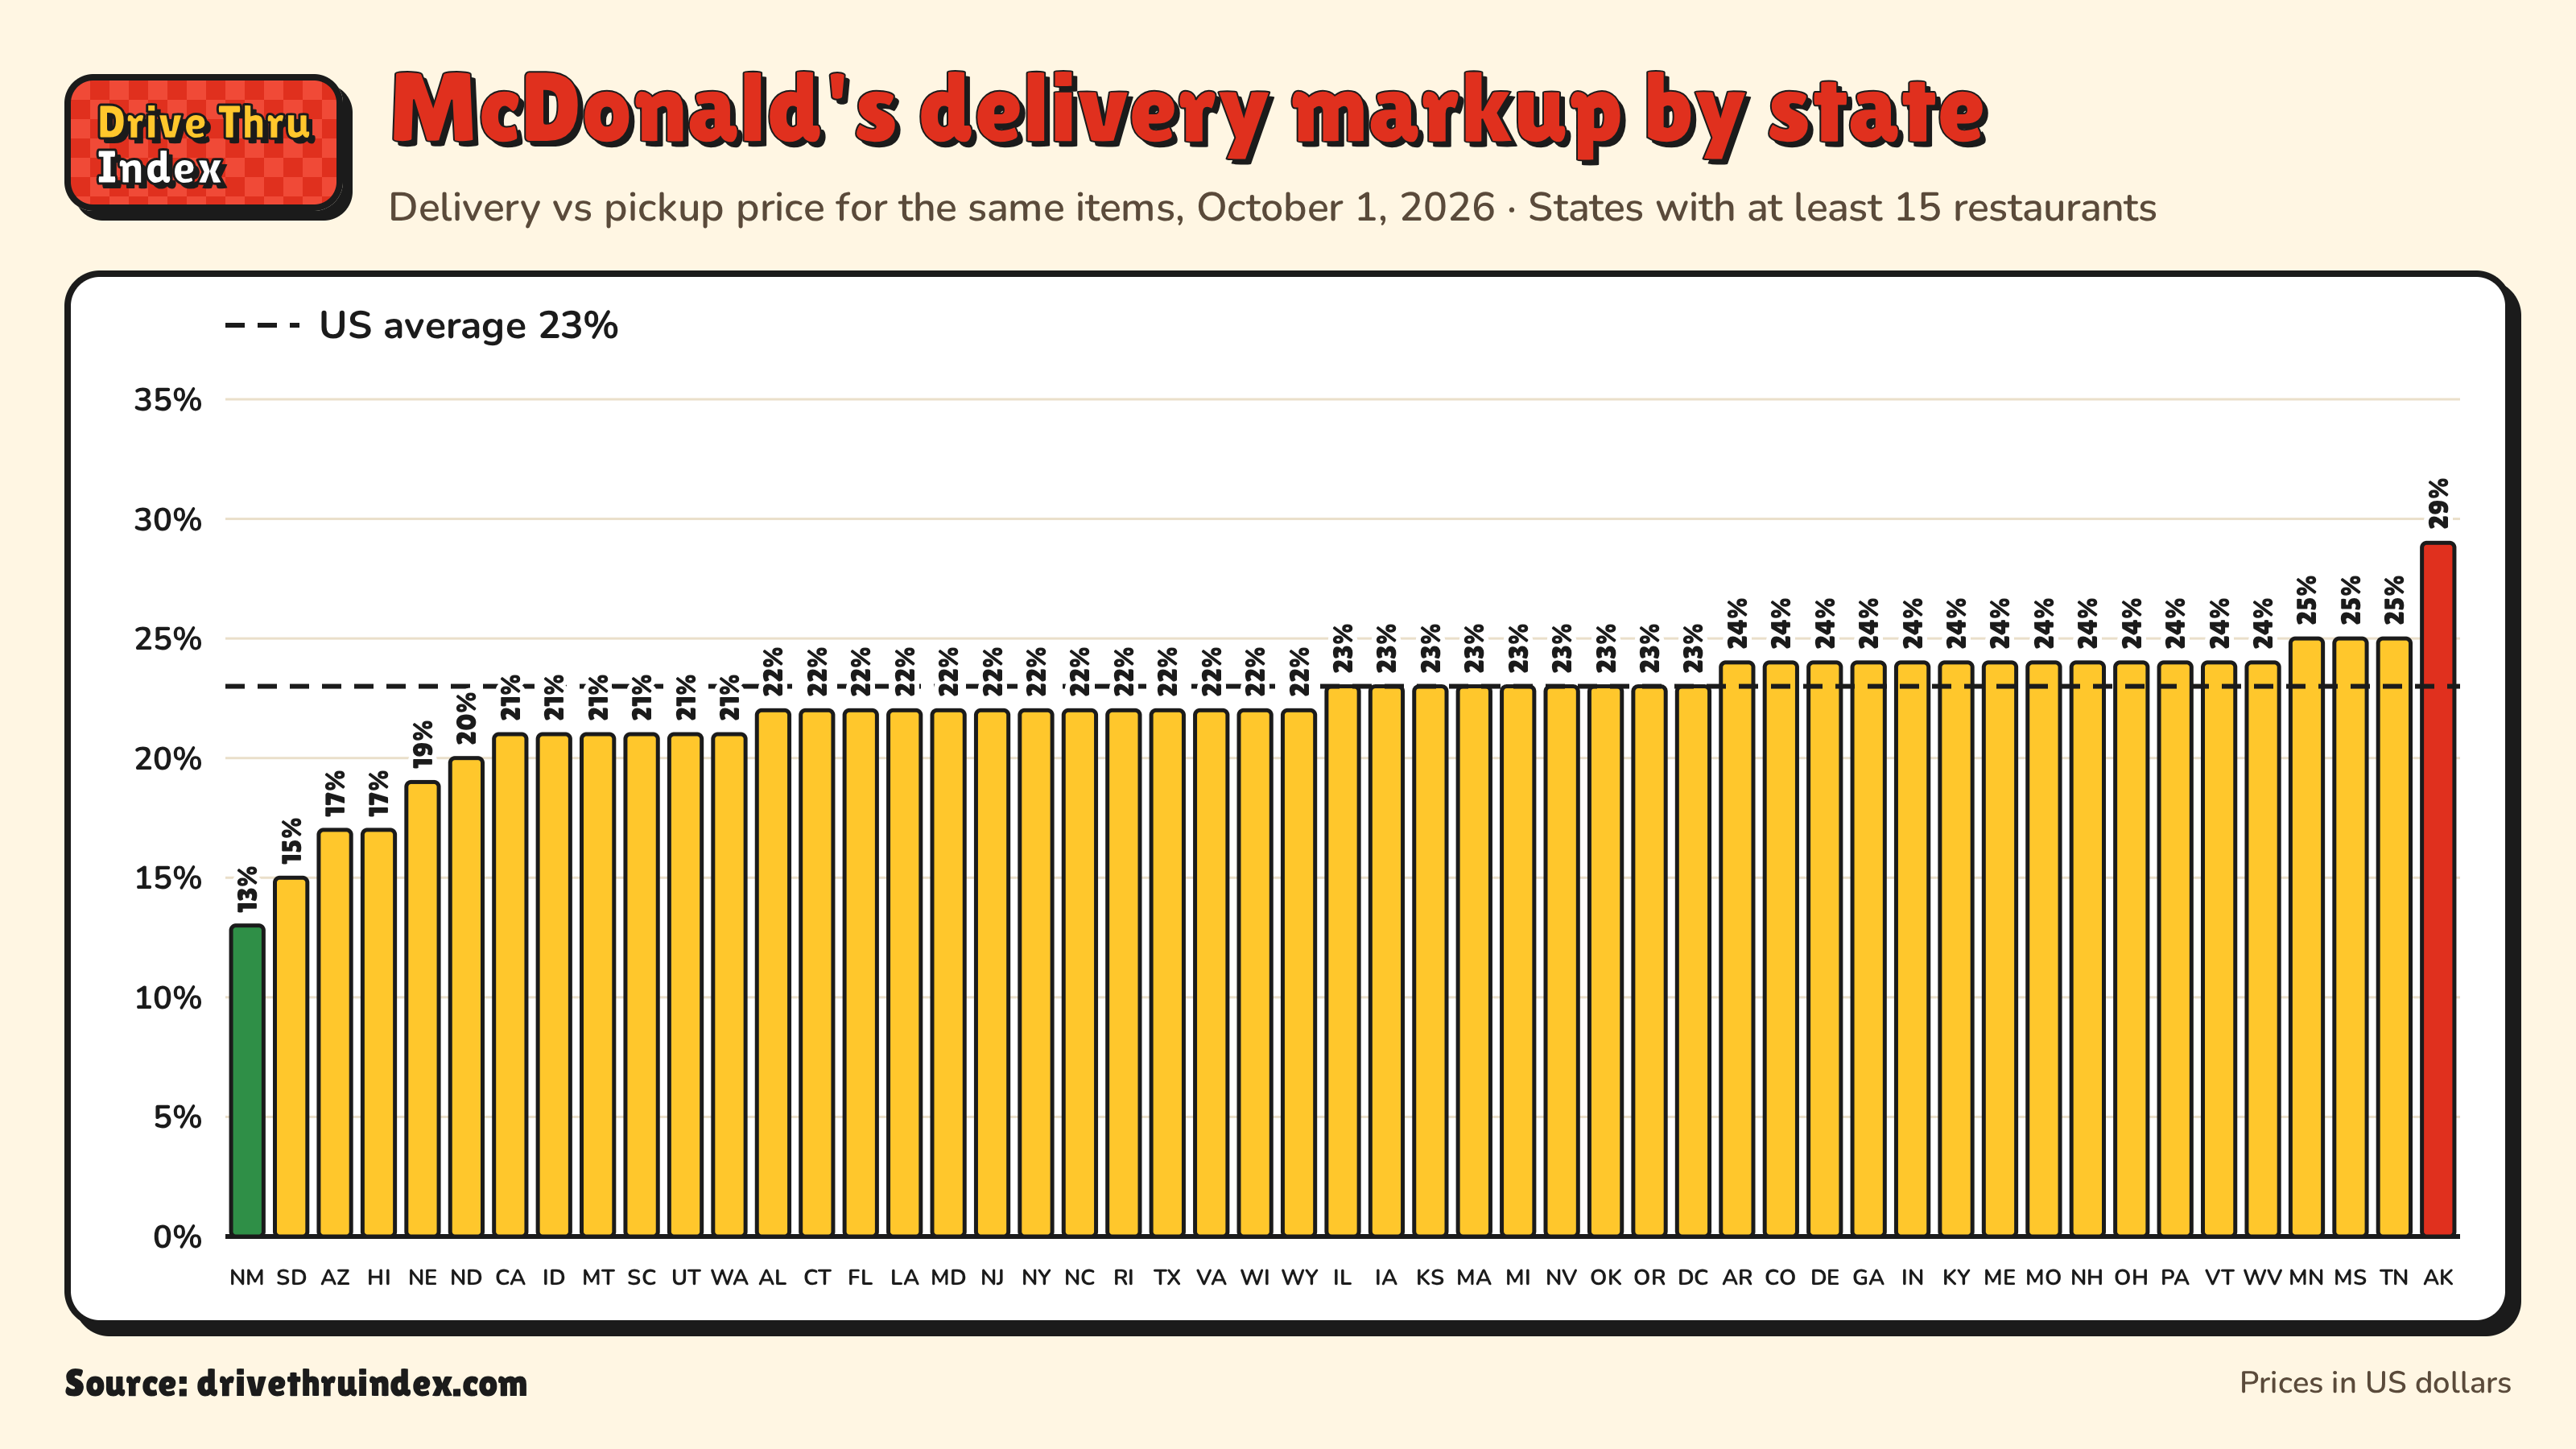
By state, the markup is highest in Ohio (57%) and lowest in New Mexico (19%).
Anthony Gherghetta, an Australian software developer who built Drive Thru Index, started it after reading some of the buzz about AI being used to set fast food prices: he wanted to see whether it was true, and how big the price differences between restaurants really were. Prices bear out the contrast he noticed. In Australia, 97% of McDonald's restaurants charge within 10% of the typical Big Mac price; in the US, 53% do. The gap between the cheapest and the dearest tenth of restaurants is 10% of the typical price in Australia and 33% in the US.
Quote, please approve“I kept reading that fast food chains were starting to use AI and customer data to set prices, so I wanted to see if it was true and how big the differences really were. In Australia, where I’m from, a Big Mac costs much the same wherever you buy it. In the US the price changes from one restaurant to the next. Fast food apps now know what you order, when and where, but customers can’t see how prices are set. So I built Drive Thru Index to check every restaurant, every day,” said Gherghetta.
Quotable lines
Ordering McDonald's for delivery costs 28% more than picking up the same items.
Ohio has the highest McDonald's delivery markup (57%); New Mexico the lowest (19%).
Images
The facts behind the release
Every figure is from our prices of 2026-10-01, with the page on this site that shows it.
| Figure | Value | Where to see it |
|---|---|---|
| Delivery adds 28% to the same McDonald's order | Average markup on items priced for both pickup and delivery, at 13,495 restaurants. | See the page |
| Highest in Ohio: 57% more for delivery | Across 600 restaurants. | See the page |
| Lowest in New Mexico: 19% more | Across 99 restaurants. | See the page |
| Pickup: the typical Big Mac costs $5.99 | Median pickup price at 13,671 restaurants. | See the page |
Median by state
| Area | Median | Restaurants |
|---|---|---|
| New Mexico | 19% | 99 |
| Hawaii | 20% | 68 |
| Montana | 20% | 45 |
| Arizona | 23% | 296 |
| North Dakota | 23% | 30 |
| Alabama | 24% | 236 |
| Louisiana | 24% | 227 |
| Texas | 24% | 1,273 |
| Wyoming | 24% | 28 |
| Delaware | 25% | 39 |
| Florida | 25% | 893 |
| Kentucky | 25% | 256 |
| Oregon | 25% | 152 |
| South Carolina | 25% | 230 |
| Virginia | 25% | 380 |
| Washington DC | 25% | 24 |
| Georgia | 26% | 444 |
| Idaho | 26% | 64 |
| South Dakota | 26% | 31 |
| Tennessee | 26% | 337 |
| Vermont | 26% | 24 |
| West Virginia | 26% | 94 |
| Arkansas | 27% | 167 |
| California | 27% | 1,193 |
| Connecticut | 27% | 135 |
| Minnesota | 27% | 215 |
| Missouri | 27% | 319 |
| Nebraska | 27% | 78 |
| New Hampshire | 27% | 54 |
| North Carolina | 27% | 474 |
| Pennsylvania | 27% | 466 |
| Washington | 27% | 257 |
| Illinois | 28% | 622 |
| Iowa | 28% | 142 |
| Maryland | 28% | 266 |
| Michigan | 28% | 510 |
| Nevada | 28% | 129 |
| Utah | 28% | 118 |
| Wisconsin | 28% | 286 |
| Indiana | 29% | 348 |
| Maine | 29% | 58 |
| New York | 29% | 566 |
| Colorado | 30% | 211 |
| New Jersey | 30% | 250 |
| Rhode Island | 30% | 30 |
| Kansas | 31% | 141 |
| Alaska | 33% | 25 |
| Massachusetts | 33% | 225 |
| Mississippi | 42% | 136 |
| Oklahoma | 42% | 204 |
| Ohio | 57% | 600 |
Methodology, about and contact
Drive Thru Index reads every McDonald's restaurant's menu from the chain's own ordering app every day, for pickup and for delivery. The markup is the average difference between the delivery and pickup price of each item priced for both, at the same restaurant on October 1, 2026, in US dollars. Delivery fees and service charges added at checkout are not included. By state figures need at least 15 restaurants.
About Drive Thru Index: Drive Thru Index (drivethruindex.com) publishes the menu price of every item at every restaurant of the biggest fast food brands, collected each day from the chains' own ordering apps. As pricing becomes more data-driven, it exists so that customers can see what each restaurant really charges and how it compares with others nearby. It covers the US, Canada, Australia, New Zealand, the UK, Ireland, Spain, Mexico and the Netherlands. Brands are only compared with themselves, and prices are never converted between currencies. Its figures are free to quote with attribution: "Source: Drive Thru Index".
The images with this release are free to use with the credit "Image: Drive Thru Index (drivethruindex.com)".
Media contact: {{press_contact_email}}
Background sources
Not part of the release: reporting that backs up its one line of context, for questions from journalists.
- How restaurant loyalty programs can drive more traffic and improve experiences Restaurant Dive, 2024-08-15
Restaurant loyalty apps pull in customers' ordering history and preferences, to personalise offers and recommendations (the intro's apps and loyalty programmes). - Wendy's backtracks on dynamic pricing Restaurant Dive, 2024-02-28
Wendy's told investors it would test dynamic and AI-enabled pricing on digital menu boards from 2025, then said after a backlash that it would not raise prices at the busiest times (the intro's experiments with data-driven pricing). - Inside McDonald's push to have AI price your Big Mac CNBC, 2026-09-29
Reports a Reuters investigation into an AI tool that recommends menu prices to McDonald's restaurants; McDonald's says franchisees remain free to set their own prices. Not quoted in the release text; the page could not be fetched to check its wording, only its search listing. - McDonald's Q2 2026 earnings release (SEC Form 8-K, exhibit 99.1) McDonald's Q2 2026 earnings release (SEC Form 8-K, exhibit 99.1), 2026-08-04
McDonald's own figures for its loyalty programme, quoted in the McDonald's releases.